National Park Service. Visitor Experience for the Next Centennial

TIMELINE
September ~ October 2014 (2 month)
DELIVERABLES
Concepts
Visitor journey map
BRIEF
Define the National Park Service’s visions for digital integration, visitor experience with digital and programs / projects to support the next generation of park visitor. A joint effort with the Accenture team.
Note: National Park Service will celebrate 100 years of serving America in 2016. Accenture has initiated this project as a gift to the celebration. And I am honored to be part of this project.
TEAM
    Engagement Lead
    Service Design Lead
> Interaction Designer
    Visual Designer (Illustration)
    Researcher
    Accenture Federal

New York, San Francisco, Washington, San Jose, Chicago
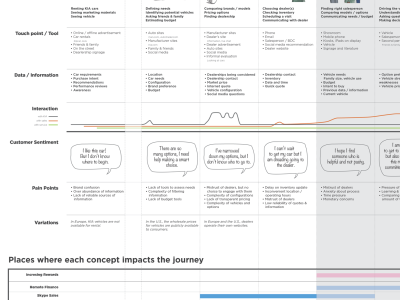
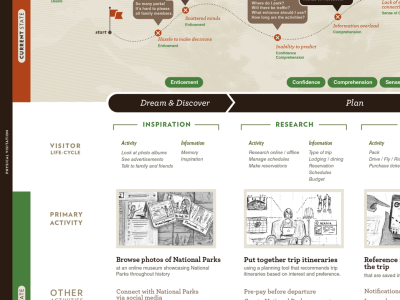
Visitor Journey Map

2014 NPS journey

^  Final deliverable that illustrates future experience with digital integration

I was responsible for creating this map and here’s the process:

STEP 0

2014 NPS park visit 1

^ Research the National Park Service organization and the visitor experience. The Fjord team had the opportunity to visit Harpers Ferry and Gettysburg where we were treated to this amazing ranger tour. Dennis, a park ranger with 30+ years experience, knows the details and history of the park by heart, and his passion for it is infectious. We learned about the dreams and challenges of delivering ‘Power of Place’ by creating ‘Boundaryless Park’.

STEP 1

2014 NPS rumble crop

2014-nps-step1

^ Generate ideas for visitor journey in the future with client at a workshop

(4 groups generate ideas for ideal visitor experience based on the personas that they developed)

 STEP 2

2014-nps-step2

^ The idea that came out of the workshop were then digitized by group facilitators. The Fjord team then talked through the ideas to construct the future visitor journey in a cohesive and polished way. I conceived a way to organize the information into a Google spreadsheet such that each row and column would function to support the story that we wanted to tell. (Simultaneously, 3 outstanding ideas are being developed into concepts. )

STEP 3

2014-nps-step3

^ Based on the Google spreadsheet, I create a draft of customer journey map so that the visual designer can use as a reference. All components, information are near the final state at this point

STEP 4

2014 NPS step 4

^ A beautiful skin is applied
(by Service Design Lead)

STEP 5

Presented to client and incorporated feedback before the final submission.
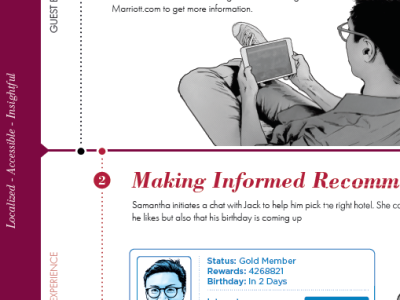
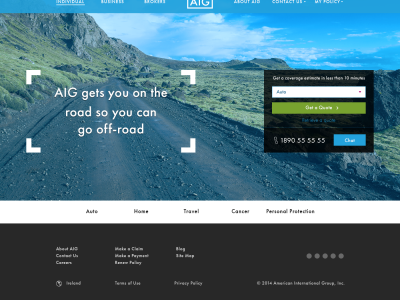
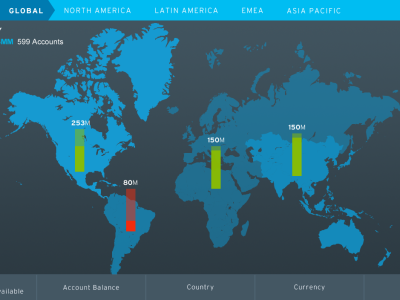
 

Concepts

2014-NPS-concept

^ Sample pages of the concept deliverable

(I collaborated with the Service Design Lead to develop the concept scripts. Then the visual designer illustrated the story.)

PROCESS
  • Research – workshop (vision, ideation) – visitor journey & concepts – capability & gap analysis

ROLE

  • played a key and leading role on the project throughout all activities
  • supported the engagement leader facilitating the workshop, synthesized the workshop result, led creation of visitor journey, and participated in concept development

CHALLENGE

  • navigating through a low budget constraint and complex work structure

RESULT

  • National Park Service is pleased with the deliverable and plans to implement
  • Accenture technology lab will be developing prototype
  • The journey map is mentioned as great examples of Fjord’s work internally

Marriott. Service Design for the Next Generation Travellers

TIMELINE
July ~ September, 2014 (3 month)
DELIVERABLES
Research summary
Competitive audit
Customer journey (current state)
Opportunities
BRIEF
Introduction of service design language for managing a customer experience that is supported by multiple channels.
Marriott’s customer service is unable to serve millennial travelers who are digital natives. In order to serve them in a cohesive and relevant way, Marriott enlisted Fjord’s vision and methodology to create an organizational change.

TEAM
    Group Director Organization Evolution
    Business Design Lead
    Service Design Lead
    Visual Design Lead
> Interaction Design
    Visual Design
    Accenture Team

New York, San Francisco, Chicago

Research Summary

2014_Marriott_5

^ Executive summary page to narrate research findings

(I participated in the synthesis and summarizing of research findings)

 2014-Marriott-trend


^ Competitive analysis as part of research summary

I was responsible for the competitive analysis. Instead of comparing hotel chains, I constructed the research as inspirations and trends. I found key trends and examples that back up the trend from various industries including hospitality, retail, travel, technology and entertainment.

Current State Customer Journey Map

2014_Marriott_1

^ Customer journey map of current state to diagnose breakpoints

(I set the foundation of the document and then visual designer added skin)

Opportunity Areas

2014_Marriott_4

^ Part of final deliverable – future opportunities

(Final deliverables were created by the visual design lead. I constructed the foundation work through the following process:)

The process of creating both customer journey and opportunities deliverables

STEP 1

2014-marriott-step2

Synthesize existing Marriott research (there’s a lot.) and Fjord’s finding to construct a comprehensive map

STEP 2

2014-Marriott-workshop-3

^ From the customer journey of current state (focusing on breakpoints), build future opportunities with client

STEP 3

2014-Marriott-workshop-1

^ Generate consensus within the team through discussions and votes

(Side note, I did these drawings)

STEP 4

2014-marriott-step3

^ Create narratives to highlight future opportunities

STEP 5

 Hand over to visual designers for final touch

PROCESS
  • Research (primary, stakeholders, competitive landscape) – workshop – customer journey / business case

ROLE

  • researched competitive landscape trend of provocative and cohesive customer service throughout multiple industries including hospitality, retail and technology to provide inspiration for higher vision for the client
  • created current state customer journey map to highlight break points of the customer experience (used at a workshop)
  • created the initial plan and set the foundation for the future state customer journey that highlights opportunities

CHALLENGE

  • comprehending complex organization that supports customer experience and visually highlighting break points and opportunities

RESULT

  • Client developing programs / projects that came out from the service design deliverables

KIA. Customer Experience from Sales to Service

TIMELINE
May ~ June, 2014 (2 month)
DELIVERABLES
Research summary
Guideline for concepts
Customer journey map

BRIEF
Discovery of opportunity areas and guidelines for customer experience roadmap for KIA in the U.S and E.U markets. Kia wanted to develop compelling and consistent customer experience from sales to service globally. Fjord New York has been selected to research and develop preliminary concepts so that Accenture Korea could implement them in customer experience management.

TEAM
    Service Design Lead
    Business Design Lead
> Interaction Designer
    Accenture Korea

New York, LA, Seoul

Customer Journey of Current State & Opportunity Areas

2014 KIA-Customer-Journey-V4-FINAL-small

^ Customer journey map from sales to service that highlights disconnected interactions between divisions in the current state. As a core team member of this project, I created this document based on our research findings and concepts. It took many whiteboard sketches and stickies to figure out the right story. Here’s the process.

Process of Creating the Journey Map

2014-KIA-research

^ The team visited dealers and stakeholders in the U.S and U.K (I visited 4 dealers in the U.S), and interviewed 8 consumers who recently purchased a vehicle.  From the interviews, we identified car buyer/owner’s pain points as well as Kia’s organizational challenges.

2014-KIA-insight

^ 7 themes were extracted out of the research findings

2014-KIA-journey-map-whiteboard-5

^ Many whiteboard sketches were drawn to find the right way to visualize our themes in the context of customer experience.

2014 KIA Customer Journey V1-01

^ The first version of the journey map is created.

2014-KIA-rumble-2

^ We presented our research findings, themes and the journey map in a client workshop to align on our vision and generate future concepts. (2 days workshop at Irvine, CA)

2014-KIA-process-final

^ After we came back to NY studio, we developed the concepts that were generated in the workshop further into more compelling stories and laid out where our concepts are applicable in the customer experience.

Research Summary and Concepts

2014-KIA

^ Sample pages of the final delivery that explains our process, principles and concepts

(I have been part of every step in the project from visiting dealers to developing concepts to support this final document)

PROCESS
  • Workshop – research (stakeholder interview, dealer interview, customer interview) – current state customer journey – concept framework

ROLE

  • as a main/solo interaction designer, supported the team leaders in every step of the project
  • created current state customer journey map that illustrates disconnections and highlights opportunity areas

CHALLENGE

  • comprehending complex organization that supports customer experience and visually highlighting break points and opportunities

RESULT

  • Concepts were further developed by Frum (Korean service design agency)
  • Client developing global programs / projects from the concepts
  • Client and Accenture Korea team who collaborated in the project were impressed by the work that we did and the way we work as well.

AIG Ireland Site & Global Design Framework 

TIMELINE
March ~ May, 2014 (3 months)
DELIVERABLES
Wireframes
Visual mockups & specs
BRIEF
AIG.ie redesign as an initial example of a global framework for AIG sites across the world. AIG sites were designed and managed by each market. It allows each market to respond to their specific market needs, however, it creates inconsistency in customer experience and inefficiency in adopting best practices among their digital products. Fjord San Francisco team researched and developed 3 concepts and the client selected a concept to move forward. Then New York team designed the product.
TEAM
    Design Director
    Service Design Lead
> Interaction Designer
    Interaction Designer
    Visual Designer
    Project Manager

New York, San Francisco

Responsive Design

2014-AIG-responsive

^ Final design for landing page

Design Process

We have designed the Ireland site as an example for a new site for all AIG sites globally. Along with simplicity and clarity as top design priorities, we considered flexibility as one of the major design principles so that the design can be adapted for each market their own specific needs.

2014 AIG sketch

^ Example of initial sketches for main navigation
(2 interaction designers exchanged ideas through sketches. When we finalize our ideas, we digitized and shared with the larger team and the client)

2014-AIG-wfr

^ Sample pages from the wireframe document

2014 AIG usability testing

^ Usability testing summary

I co-authored the testing script and supported the team to create a prototype to be used for the testing (Axure). Team members conducted the usability testing in Ireland while I supported real-time synthesizing with video recordings in New York.

PROCESS
  • (Workshop – research – concept) – detail design – usability testing

ROLE & CONTRIBUTION

  • joined the project as a main interaction designer from detail design phase
  • interpreted complex flows into simple interface
  • created systemic framework that can be reused globally
  • supported prototyping and set up the usability testing (scripts / synthesis)

CHALLENGE

  • persuading client to the suggested design directions
  • considering scalability for every design decision

RESULT

  • AIG Ireland site has launched in 2014, and the design has been adopted for other markets globally since then.
  • AIG Korea has adopted the new design, and re-launched in February 2016. AIG earned an Excellence Prize at Web Award Korea, hosted by the Korea Internet Professional Association (KIFPA). Web Award Korea, established in 2003, is one of the country’s most prestigious awards for digital content, web design, and user experience.

Citibank. Tablet App for Corporate Banking

TIMELINE
November 2013 ~ January 2014 (3 month)
DELIVERABLES
Rumble (Workshop) and synthesis
Wireframe
Visual design
Prototype
BRIEF
Enhancement of Citi Direct BE tablet app (banking app for corporate and public sector customers.). Fjord has designed the first version of Citi Direct BE app (iOS only), and Citibank came back to design the next version of the application which would expand to Android and Windows platforms.
Corporate banking involves multiple bank accounts in multiple currencies and multiple banks in many geographical locations. The users of this app can be senior treasurers or CFOs who would need a birds eye view of their organization’s finance and make decisions.
TEAM
    Business Design Director
    Service Design Lead
> Interaction Designer
    Visual Designer

New York, Dublin

Final Design

2014-CTS-mockup-2

2014-CTS-mockup-1

^ Final design for map view and chart view

Design Process

2014-CTS-rumble-deck

2014-CTS-rumble

^ 2 days workshop with clients to set the vision and deep dive in corporate banking

2014-CTS-whiteboard

^ Architecture sketches for multiple platforms

2014 CTS wfr 2

^ Sample page of platform exploration document

2014 CTS wfr 1

^ Detailed speculation for filtersets

Out in the Market

2014-CTS-appstore google

2014-CTS-appstore windows

2014-CTS-appstore-apple

^ In the fall 2014, the app is out to Apple Appstore, Android marketplace and Microsoft Windows store.

PROCESS
  • Stakeholder interviews – workshop – design research – detail design – prototype

ROLE

  • support facilitating the 2 days workshop
  • translated a complex banking data into a comprehensive story by providing clear rules and developing patterns of the UI
  • recommended design framework for multi-platform development (Windows Surface, Android and iOS)
  • created click-through prototype (InVision) for demo

CHALLENGE

  • understanding complex subject matter
  • creating robust, and yet easy-to-use tool

RESULT

  • developed by Citibank Innovation Lab in Dublin and out in the market in the fall 2014

  • won the award for Best Mobile Service or App for the Enterprise at the Mobile World Congress in Barcelona, 2015. Citi was the first bank to receive this award, the honor have been given to tech or telecommunications sector in the past.

Play with Playmobil. Service Design Prototyping Tool

TIMELINE

December 2013 ~ March 2014 (3 month)

BRIEF

One of the best way to build a successful digital interface is through prototyping (AKA failing fast). Same principle can be applied to service design, but we have limited tools to prototype systems where we have to consider people and surroundings. To bring service design methodology in our everyday design practice, Lena Hammes and I proposed to purchase a series of Playmobil. The small size replication of our world can be used in all stage of service design process from visualizing complex systems to envisioning design solutions.

Our proposal was accepted and I ran two series of design sessions to show what they are, and how we use them.

NOTE

This was not a client project, but an initiative that came out of my curiosity. Finding a way to work better as a team is also a big part of what I do at Fjord.

Proposal

2014 Playmobil proposal

^ Summary of our proposal

They are here!

2014 Playmobil

^ This is a shot from the day it arrived (January, 2014). After the arrival, I ran a couple of design workshops to promote our new hires into the studio.

Design Workshop Part 1

2014-Playmobil-workshop1

^ On Feb 14, 2014, I invited everyone in the New York studio to brief what we’ve got and why we got them as well as to give them hands-on experiences. We divided into 3 groups and within 30 min of time, they produced really fun stories told with Playmobils.

Design Workshop Part 2

2014 Playmobile example

^ Soon after the first workshop, designers started using Playmobil in their work. A team did a great concept deck to show a workflow of an app that they were designing, which was a great way to visualize the usage of the app without showing too much details. Another team bought more Playmobil sets to use in the business development deck to visualize their perception on the subject matter. On March 21, we had ‘Play with Playmobil’ workshop part 2 to showcase these examples.

Aetna. Designing New Business for Workforce Availability 

TIMELINE
April ~ November, 2013 (8 month)
DELIVERABLE
Service blueprint
Stakeholder map
Workshop
Concepts
Wireframes
Visual design
Prototype
BRIEF
New business development around workforce management within Aetna from concept to product. At Aetna, internal new business development team has embarked on a journey to develop a new business in regards to managing absence in organizations. Fjord was selected to define the details of the new business, develop core concepts and design the MVP which involves multiple types of users. (employee, supervisor, and Aetna service representatives)
TEAM
    Service Design Lead
    Business Design Lead
> Interaction Designer
    Visual Design Lead
    Project Manager
    Prototyper
    Developers

New York, Hartford

Discovery

2013 AWA stakeholder map

2013 AWA process map

^ After talking to multiple stakeholders, day-in-life research and a 3 day workshop with Aetna and the potential clients for the new business, the team have learned the complexity of how currently workforce availability has been managed in large corporations.

Framework & Strategy

2013 AWA service principles

2013 Aetna framework

^ Design framework and principles

Concepts

2013-AWA-concept

^ From the framework, we’ve envisioned 3 concepts

Detail Design

2013-Aetna-vd3

^ Final visual design samples for 3 types of users; employee, supervisor and the service admin

2013-Aetna-wfr

^ The Fjord team identified 3 major user types of the service and designed an online service with 3 faces; for employees, for front-end supervisors and for service representatives. The images are the sample pages from the wireframe documents. Wireframes were used to communicate with visual designers, clients, and developers who were building the MVP for initial release.


PROCESS
  • Research (stakeholder interviews – field interviews – stakeholder map – service blueprint) – concepting – detail design – development

ROLE

  • as a core team member of the design team, support all aspects of service design in this complex multi-actor play from the beginning to end
  • support facilitating 3 days workshops (lead breakout sessions) to define actors, their relationships and the workforce management processes
  • played an integral role in stakeholder interviews, field interviews, concept and direction development.
  • designed detailed interaction for multiple users of the system

CHALLENGE

  • complex system – hard to comprehend by anyone. compiling many voices of constituents and stakeholders, tight timeline for detailed design for multi users

RESULT

  • ceased while MVP under development

Qualcomm + U.S Preventive Medicine. Personal Health Management

TIMELINE
April 2011 ~ December 2012 (1 year 9 month)

DELIVERABLES
Product development

BRIEF
Personal health management for mobile users. U.S. Preventive Medicine (USPM) had been running a health care program to help participants live long good years. They had an online site to support the program, and partnered with Qualcomm to translate the online experience onto mobile platform. For almost 2 years, USPM (content), Qualcomm (technology), and Fjord (design) collaborated to create Macaw app (for iOS and Android) that helped tens of thousands of users manage their health on mobile.
From ground 0, we launched a personal healthcare app that connects to multiple tracking devices and provides health information by medical experts. After the first launch we expanded the app into disease management platform.

TEAM
[DESIGN] Service Design Lead
> Interaction Designer
Senior Visual Designer

[ENGINEER] iOS developer
Android developer
Qualcomm (Server technology)

[CONTENT] U.S. Preventive Medicine (Medical experts)

New York, San Diego, Jacksonville, Toronto, and Austin

Final Design

2012 Macaw 1

^ Macaw app, screen for trackers. This project was my biggest effort of all at Fjord.

Process

PHASE 0: Experience Design

2011 Macaw game

^ This is a sample page that explains the gaming mechanics to create sticky experience. The team had many ideas around how to bake the habit of coming back to the app. The mechanics we considered include accomplishing bite sized actions, leveling up, getting rewards, learning, competing and being part of a team.

PHASE 1: Launch

2012 Macaw 2

^ We launched Macaw app for iOS in November 2011 (5 month after the project started). Through personalized action cards, users participate in healthy activities as well as learn about why the activities help maintain good health. Users could plug in third party health trackers such as Bodymedia or Withings devices to log progress automatically.

PHASE 2: Rethink health – mind, body and social

2012-Macaw-revise

^ After our first launch, we had the opportunity to look at the app with fresh eyes. We’ve consulted with many medical experts and approached health in a larger context; health is a state of mind, body and social. Fjord team proposed a new way to visualize health state and the progress with the images above.

PHASE 3: Design for disease management

2012-Macaw-diabetes

^ While we plan to revise the app with more holistic approach, the larger team envisioned that disease management would be the next big step for the application. As a first example, we designed a section for diabetes.

2012 Macaw wfr 4

^ A sample page explaining on-boarding flow of disease management

2012 Macaw wfr 2

^ Detailed speculation document for tracker screen

2012 Macaw tracker wfr

^ Design for preventive health management to disease management was quite a big step. It involved learning much about the disease and life with diabetes as well as trackers for specific measures of the body. For diabetes, we’ve designed trackers for weight, nutrition, exercise, blood glucose, blood pressure, hemoglobin (a1c) and medication. (Nutrition tracker alone felt like a designing a whole new app!) We also worked hard to find a holistic and personal view of all measures. The image above is a sample wireframe document that explains how the tracker overview screen works.

Design iteration

^ This image shows the evolution of trackers from summer 2011 to winter 2012.

PROCESS
  • Workshop (initial concept definition) – detail design – release – design revision – release – design revision

ROLE

  • main ixd throughout the project from the initial concept development to detailed design
  • designed the experience, app architecture and detail screens

CHALLENGE

  • designing for behavior change
  • understanding the complex subject matter, especially for disease management

RESULT & RECOGNITION

  • First version launched after 6 month in
  • CES Mobile Apps Showdown Winner 2012
  • CTIA Emerging Technology Award 2012
  • NDEP Frankie Award 2012
  • Finalist for 2011 CTIA Hot for the Holidays Awards 2011

Citibank. Strategy for Dynamic Offers Engine

TIMELINE
May ~ July, 2012 (2 month)
DELIVERABLES
Messaging framework
Concepts
Visual design
Prototype
BRIEF
User experience strategy and concept development for Citibank Dynamic Offer Engine (DOE).
Citibank has an enormous amount of deals and the technology (DOE) that can offer the deals to a large number of customers in a personalized manner. The engine has a capability to intelligently match customer’s profiles with the right deals. Fjord was selected to vision the experience and develop concepts of how deals can be delivered to customers in digital channels.
TEAM
    Service Design Lead
> Interaction Designer
    Visual Designer
    Prototyper
    Project Manager

New York

Final Screens

2011 Citi offers mobile 1

^ Offers promotion example

2011 Citi offers mobile 2

^ Screen to browse offers

2011 Citi offers mobile 3

^ Rewards page example

Framework

2012-CIti-offers

^ Fjord team created the messaging framework for Citibank.

Concepts

Within the framework, we came up with a few cases that show the best matches for content and the channels. Based on the concept sketches, I made 3 videos (with Keynote) to quickly illustrate what the end-user experience might be

2012 Citi_Mobileoffers_ActionableInbox

^ Concept: Actionable Inbox

2012 Citi_Mobileoffers_QuickPay

^ Concept: Quick Pay

2012 Citi_Mobileoffers_OffersInContext

^ Concept: Offers in Context

2011 Citi offers tablet 2

^ Later in the project, the concepts were fleshed out as prototype

PROCESS
  • Research – concept development – UX prototype – visual design – prototype on iOS

ROLE

  • heavily involved in the first phase of the project
  • generated and sketched initial concepts into moving wireframes to illustrate high level concepts

CHALLENGE

  • understanding complex system

RESULT

  • Client developed the concepts into offerings.
  • “The work you have done is fantastic. We especially appreciate how closely you worked with the Global redesign teams to ensure we were developing concepts that will fit into the framework of the new apps. This has been a major help. Over the past week or so I have been going around to different business partners to show them the concepts, solicit input and generate enthusiasm/support for a Mobile Commerce project in 2013. The prototype your team built has made these meetings incredibly easy – people are wowed by your work and are very excited to get going in the mobile space.”- from the client

Design Clinic. Weekly Gathering on Design

TIMELINE
September, 2012 ~ Now (over 2 years)

ACTIVITIES
Internal presentation
Guest presentation
Field trips
Design workshops
Debate
Video watching

BRIEF

Weekly design discussion in Fjord New York studio. I initiated and organized this series of meetings with 2 other colleagues, Nour Diab and Petra Farinha, over 2 years to support education, inspiration and bonding. Every Friday 4 PM I go around and ring beer bell in the studio, and we all gather to talk about design. I am very happy that we, as a team, spent time together to cultivate our own curiosity.

TEAM
> Organizer
Everyone

New York

2014 Design Clinic drawing3

^  Design Clinic on Drawing by Visual Design Lead, Brian McLaughlin. April, 2014

2014 Design Clinic fieldtrip-cooperunion2

^  Field trip to <Image of the Studio, a portrait of New York City graphic design> at Cooper Union. October, 2013

2014 Design Clinic littlebits

^  LittleBits Workshop with LittleBits. August, 2014

2014 Design Clinic IxDA

^  Extended Design Clinic as IxDA meetup on Wearables. August, 2014

ROLE

  • initiator, curator, organizer, occasional presenter and all time beer ringer
  • recruited internal and external speakers
  • organized field trips to various types of exhibitions
  • facilitated design exercises

HIGHLIGHTS

  • internal presentation/workshop: what’s happening in Congo, 3D printing, design + business
  • guest speakers: Critter and Guitari, LittleBits, BeerBot
  • fieldtrip: Pencil to Pixel at Monogram, Applied Design at Moma, Brooklyn Design at Dumbo
  • design workshop: improv, play with playmobile (I led 2 sessions), book binding
  • debate: debate over ‘How to lie with Design Thinking’ with Dan Saffer
  • video: The Invention of Dr.Nakamats, Objectified

CHALLENGE

  • Fjord New York studio has been growing very fast in size and the organization became challenge over time

RESULT

  • grew into 3 people team with Nour Diab and Petra Farinha
  • Mentioned as heros at Fjord USA gathering
  • in employee surveys, team members mentioned Design Clinic sessions as highly valuable time at Fjord.
  • in September 2014, we opened a session with larger design community by hosting IxDA meetup (on wearable). We sold out 80 seats in a day, and participants were very engaged.